As an advisory firm that has a vested interest in the value of our clients’ accounts, our primary focus is to lower our portfolio costs. The number of individuals and families we meet with that have no idea what their investments are costing seems to be limitless. That is our starting point. Although we appreciate the trust our clients have in us to manage their assets and plan their future, we don’t just want you to hand over the keys and check in when it’s convenient. We look to help you understand the process, mechanics and costs when working with us – because it’s your money. What are your all in costs of investing?
Because It's Your Money!
Actual Toomey Portfolio
- Core Sweep Position = Money Market Rate of Return
- Average ETF Expense = . 12%
- Mutual Fund Expense = .02%
- Commissions & Transaction Fees on US Equities = ZERO
- Transfer/Maintenance/Service Fees = ZERO
AVG. PORTFOLIO COSTS
0.09%
Hypothetical Managed Portfolio
- Core Sweep Fund = Not Always held in Money Market. Return sometimes as low as .01%
- Average ETF Expense = .56%
- Average Actively Managed Mutual Funds Expense = .79%
- Commissions on Individual Stocks/ETFs = $9-$14 per Transaction
- Mutual Fund Transaction Fees = $9.95 – $49.99
- Transfer/Service Fees = $20-$50
AVG. HYPOTHETICAL PORTFOLIO COSTS
0.82%* **
* Based on 40 annual individual stock transactions, 30 Mutual Fund Transactions and a $20 service fee – 60% Mutual Funds 40% ETFs.
** Cost comparison does not factor in reduced return of non-Money Markey core sweep position
If you add an advisor fee to these, you may be looking at about 2.00%+ in all-in expenses. This is before you’ve even realized a return!
References
https://www.valuepenguin.com/mutual-funds-transaction-fee-comparison
https://www.fidelity.com/why-fidelity/pricing-fees?imm_pid=700000001008518&immid=100766&imm_eid=ep48877640497&gclid=Cj0KCQjwsLWDBhCmARIsAPSL3_0PUYqEQtP6A6gewWP0hOsUc587Gopb6Gv2NRD_DxqAyr73wNzP61saAhn2EALw_wcB&gclsrc=aw.ds
https://www.investopedia.com/ask/answers/032715/when-expense-ratio-considered-high-and-when-it-considered-low.asp
A More Modern Approach
We have 9 models that we’ve designed as our core investment in each client account. This is our way of getting the appropriate level of broad exposure and diversification in key sectors and markets around the globe. While a lot of firms might stop there, we look to build onto that strategic core with a tactical approach that encompasses a precise weighting of select positions – usually individual stocks — aimed at optimizing your resources and goals. Remember: our average core expense ratio is below a tenth of a percent at most, and because we don’t have to worry about the snowball effect of transaction fees and trading commissions, we are free to manage your money with fewer constraints.
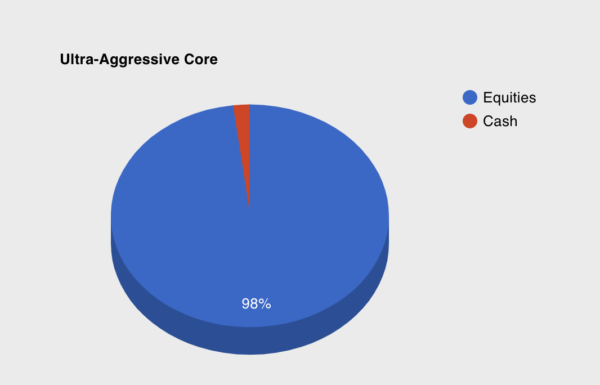
For the investor that has a high tolerance for risk and a long time horizon. This will consist of about 2% Cash 98% Equities – 30-40% of which is typically more speculative growth and value individual stock positions.
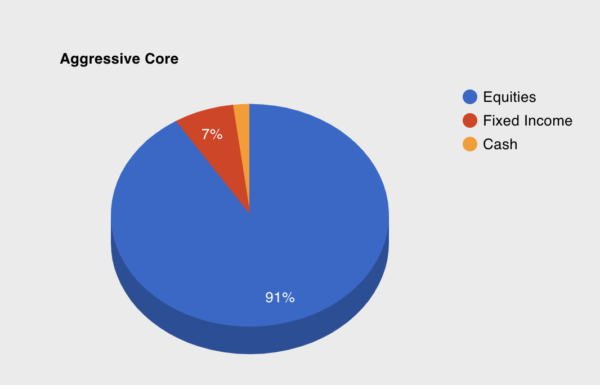
Our Aggressive asset mix will hover at around 91% Equities, 7% fixed income and 2% cash. This is for the investor who isn’t afraid of risk, would like to optimize growth prospects, but still wants a little buffer of protection that can be opportunistically liquidated in the case of a severe market downturn.
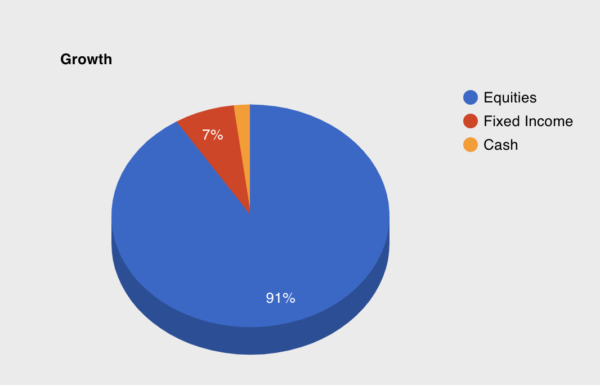
Our Growth mix is very similar to our Aggressive mix except the equity exposure is that of strictly growth oriented companies. This is extraordinarily useful for those who don’t prioritize investments that generate current income for shareholders, but focus merely on reinvestment of capital for sustained growth.
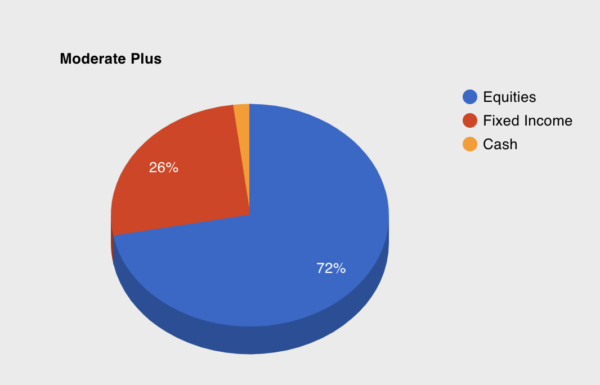
The Moderate-Plus Core model has a general asset mix of about 72% equity exposure, 26% fixed income and 2% cash. This is a diversified mix of asset classes, market caps, and sector exposures that still has a focus on appreciation, but also provides a level of diversity appropriate for many different investors.
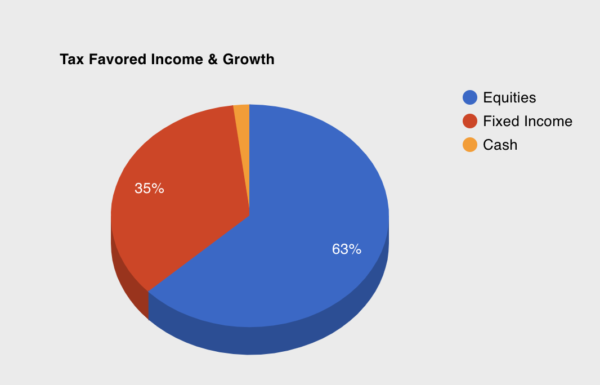
Tax Favored Income and Growth is comprised of about 63% equities, 35% in-state municipal bonds and 2% cash. This asset mix is appropriate in taxable brokerage accounts for high net worth clients looking to mitigate their tax burden, while also retaining exposure to growth companies that do not provide taxable current income.
The Moderate Core model asset mix is 65% equity exposure, 33% fixed income and 2% cash. Equity exposure is geared towards high dividend yield, large cap growth and defensives. This is an effort to tamper down volatility while also providing ample opportunity for appreciation.
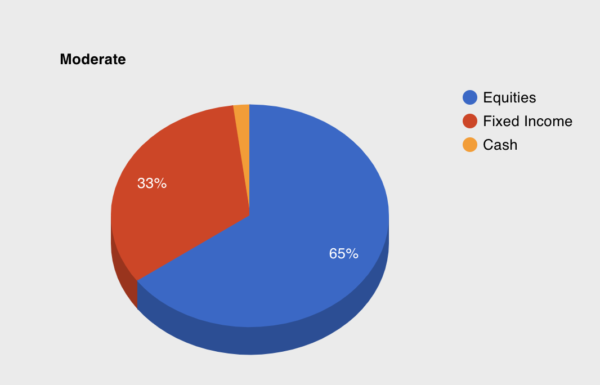
For the slightly risk adverse investor, our moderately conservative core model is comprised of 60% equities 38% fixed income and 2% cash. Like moderate, the objective for this allocation is reduced volatility by way of defensive equities and increased fixed income weighting.
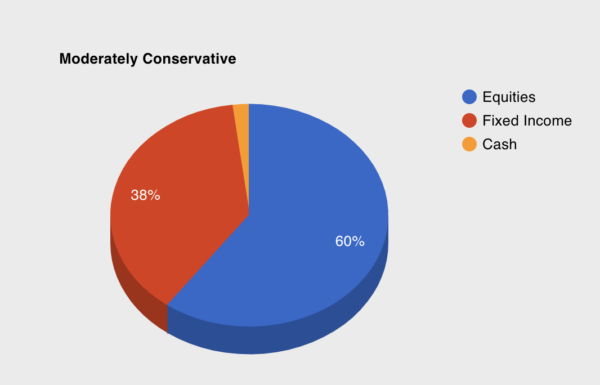
The Conservative Core has 52% defensive and mega-cap equity exposure, with 46% fixed income, and 2% cash. Reduced volatility, high dividend yield with a protective variety of bonds is criteria used to describe this asset mix.
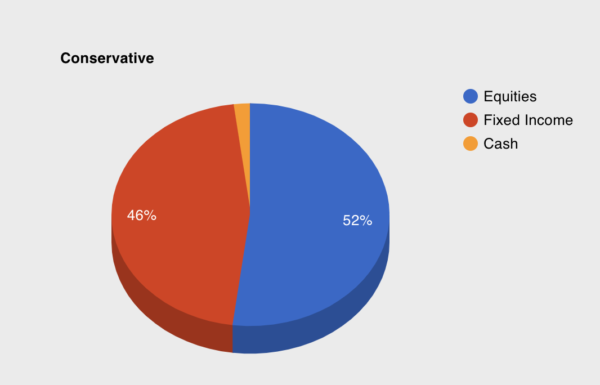
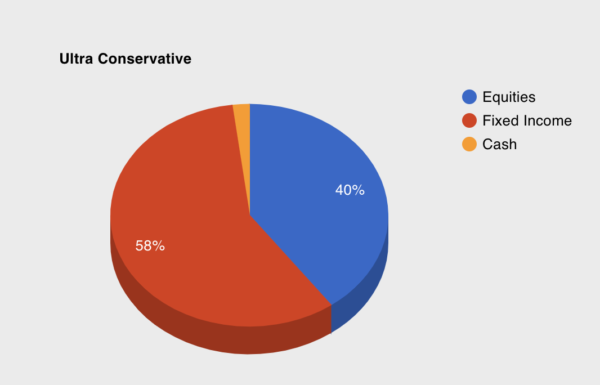
Our Ultra Conservative model is 40% equity exposure, 58% fixed income, and 2% cash. Like our Conservative core, the focus is on defensive sectors and companies that have a high dividend yield to provide consistent current income. Within the fixed income mix can be found treasuries and investment grade corporate bonds. IF market conditions dictate, we may infuse the portfolio with inflation hedges such as precious metals.
Are You Confused?
If you just want to talk and cut through the fog of financial advice, we would be happy to explain how it all works along with helping you develop a road map to reach your goals.

